VectorMag v1.0: 3D Magnetic Inversion Benchmark Against Industry-Standard Commercial Software
Fabrício Santos · September 16, 2026 · 7 min
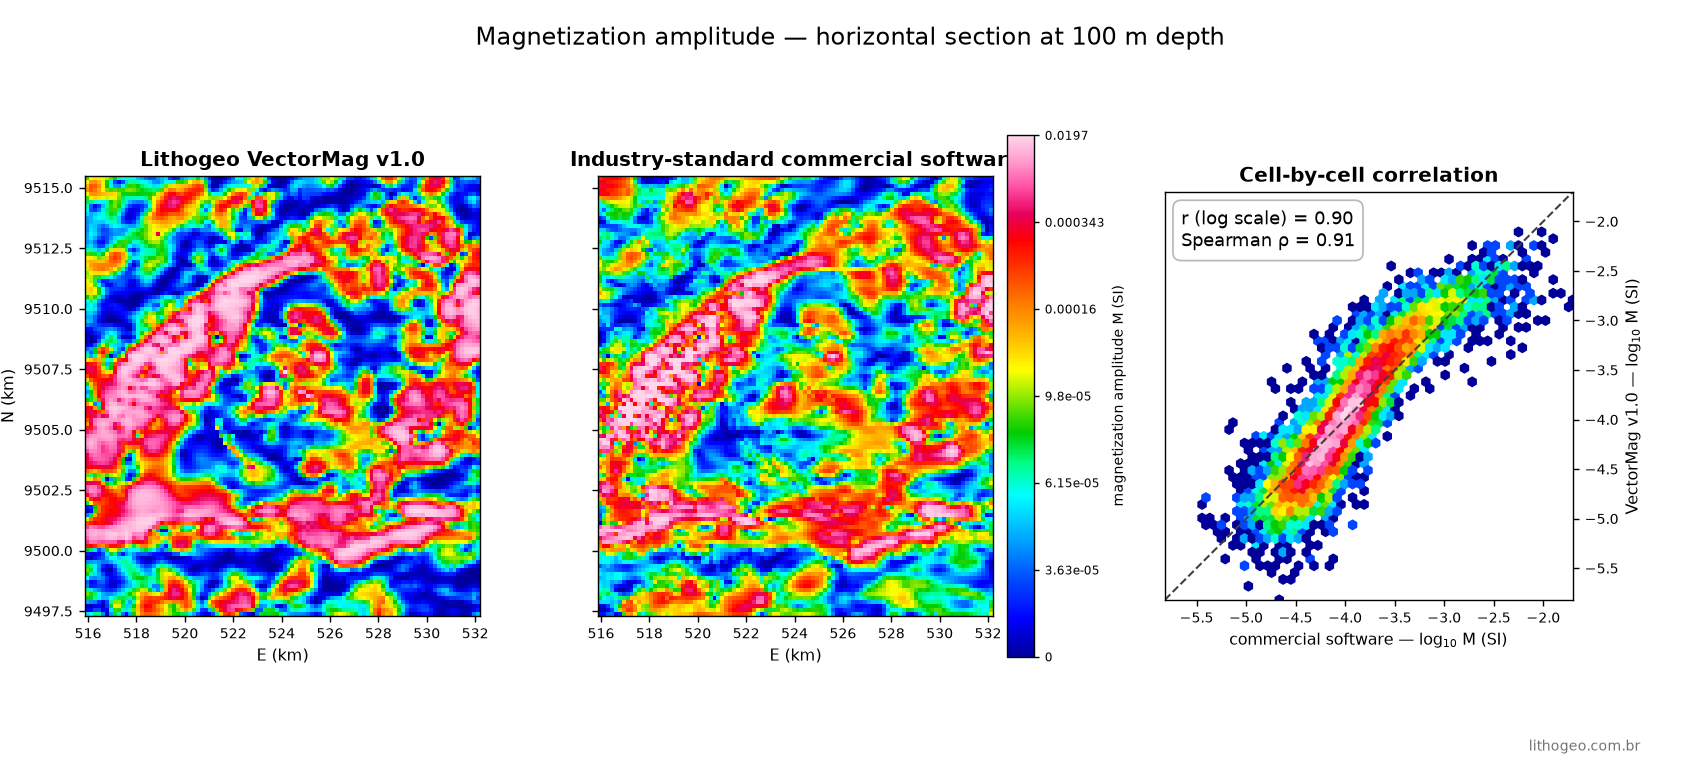
When a new inversion engine reaches the market, there is only one question worth asking: does the result match what the industry already uses and trusts? To answer it head-on, we put the first release of our engine — VectorMag v1.0, the 3D Magnetic Inversion module of the Lithogeo platform — side by side with industry-standard commercial software, on the same area and the same input data. This article shows the result slice by slice, no retouching.
How the test was set up
For a fair comparison, both tools received exactly the same problem:
- Same area: ~16 × 18 km in northeastern Brazil, public airborne magnetic survey (500 m line spacing, sensor 100 m above terrain).
- Same data: the same residual magnetic field grid and the same elevation model; same reference geomagnetic field (IGRF).
- Same physics: both ran MVI — magnetization vector inversion, which does not assume the magnetization direction and therefore handles remanence.
- Full independence everywhere else: each tool used its own mesh, its own regularization and its own regional-field treatment. One telling detail: both independently picked practically the same horizontal cell size (~165 m) for this dataset.
Both models fit the observations within the statistical target (χ²/N ≈ 1) — that is, both explain the data equally well. The difference that matters is in the 3D model each one builds. To measure it, we cut both models into horizontal sections at constant depth below terrain and correlated them cell by cell, on a log scale (rock magnetization spans several orders of magnitude).
The result, slice by slice
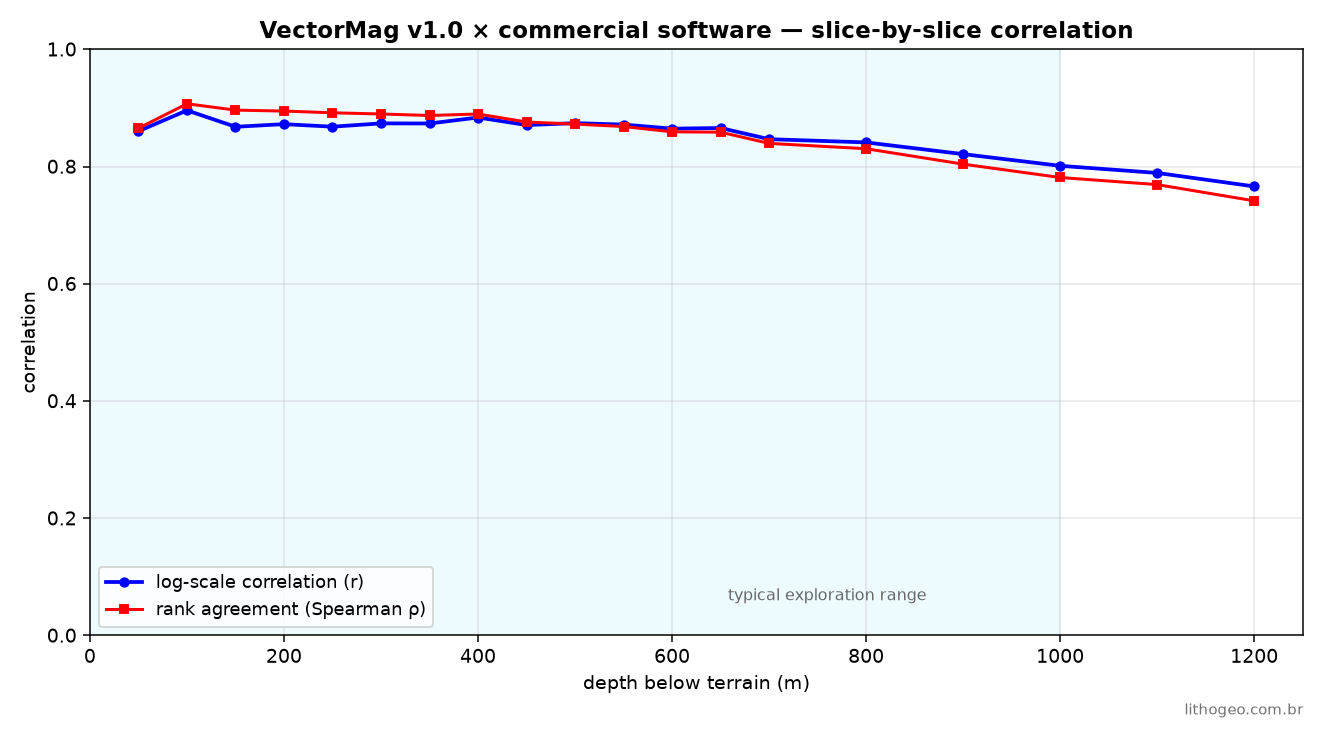
This curve sums up the whole benchmark: log-scale correlation stays between 0.86 and 0.90 from the surface down to 600 m and remains above 0.80 down to 1,000 m — the range where mineral exploration actually happens. Rank agreement (Spearman's ρ) tracks right along, meaning both tools rank the same zones as hot and cold, in the same order.
The sections, side by side
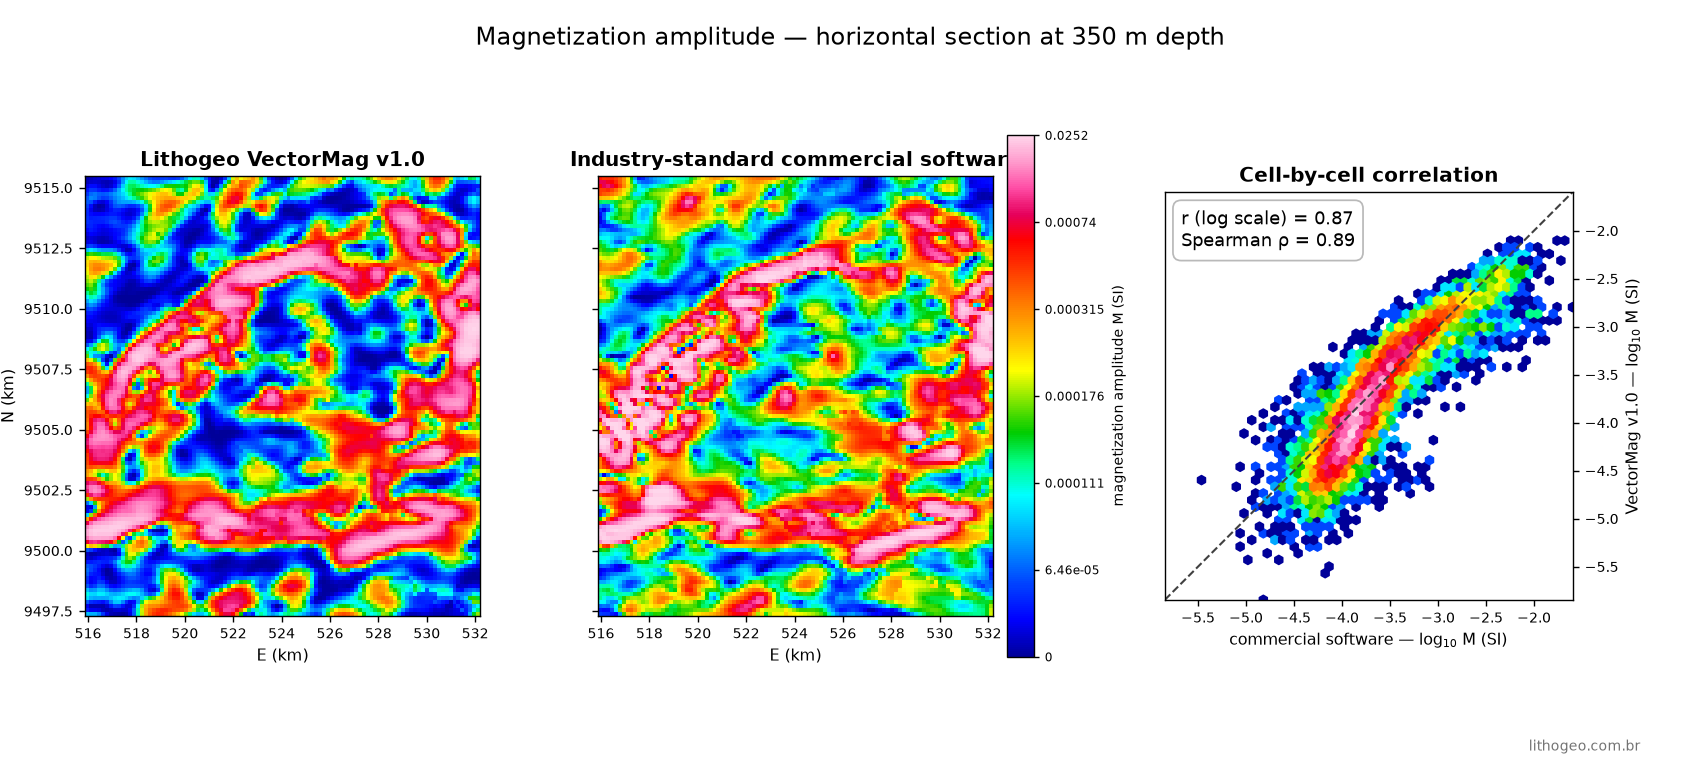
Below, four depths — each figure shows VectorMag v1.0, the commercial software and that slice's correlation plot, all on the same color scale.
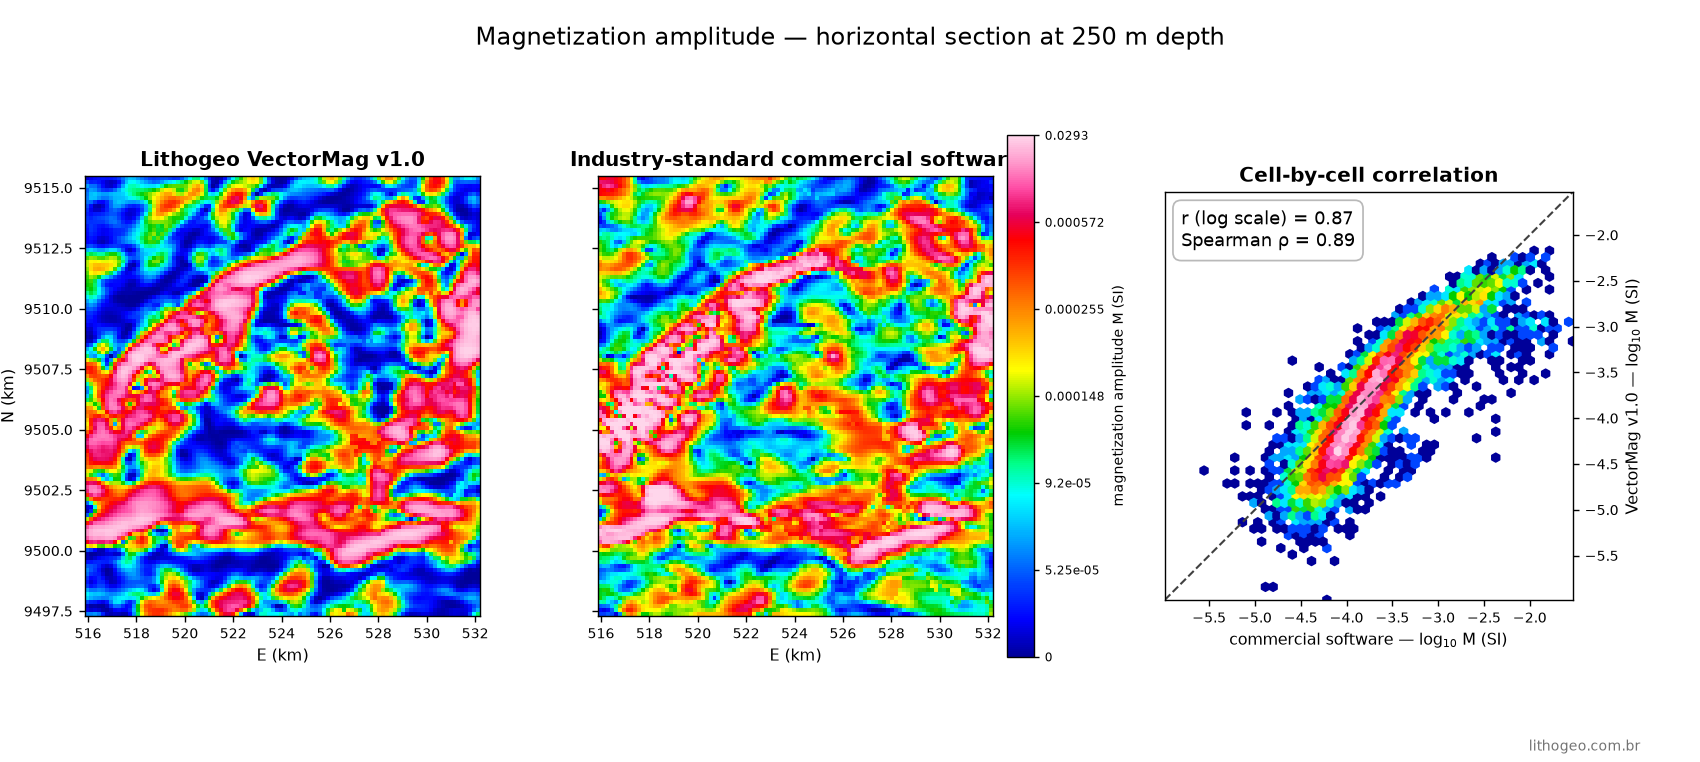
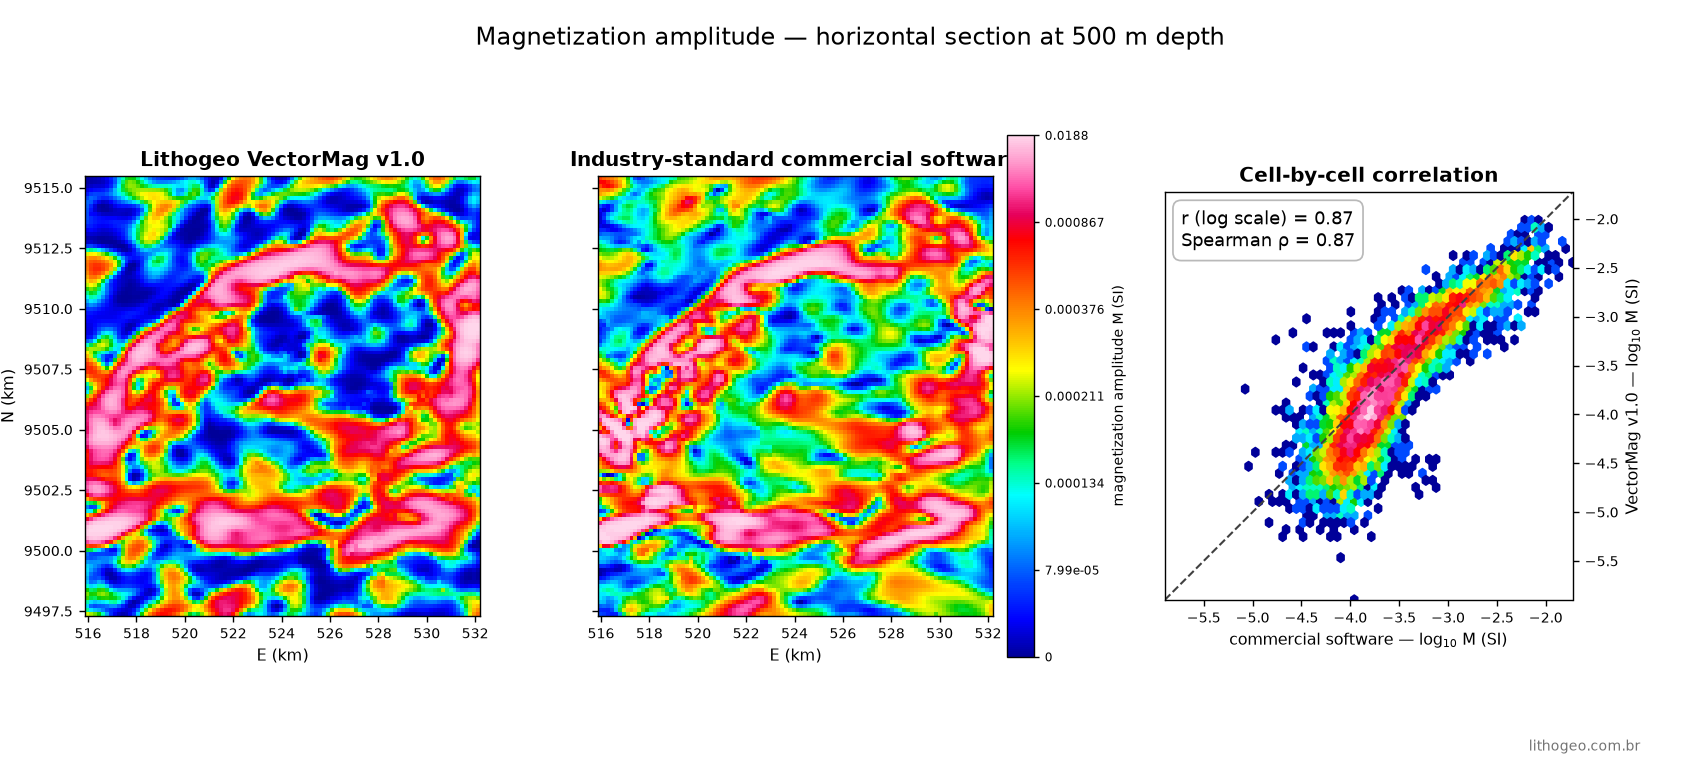
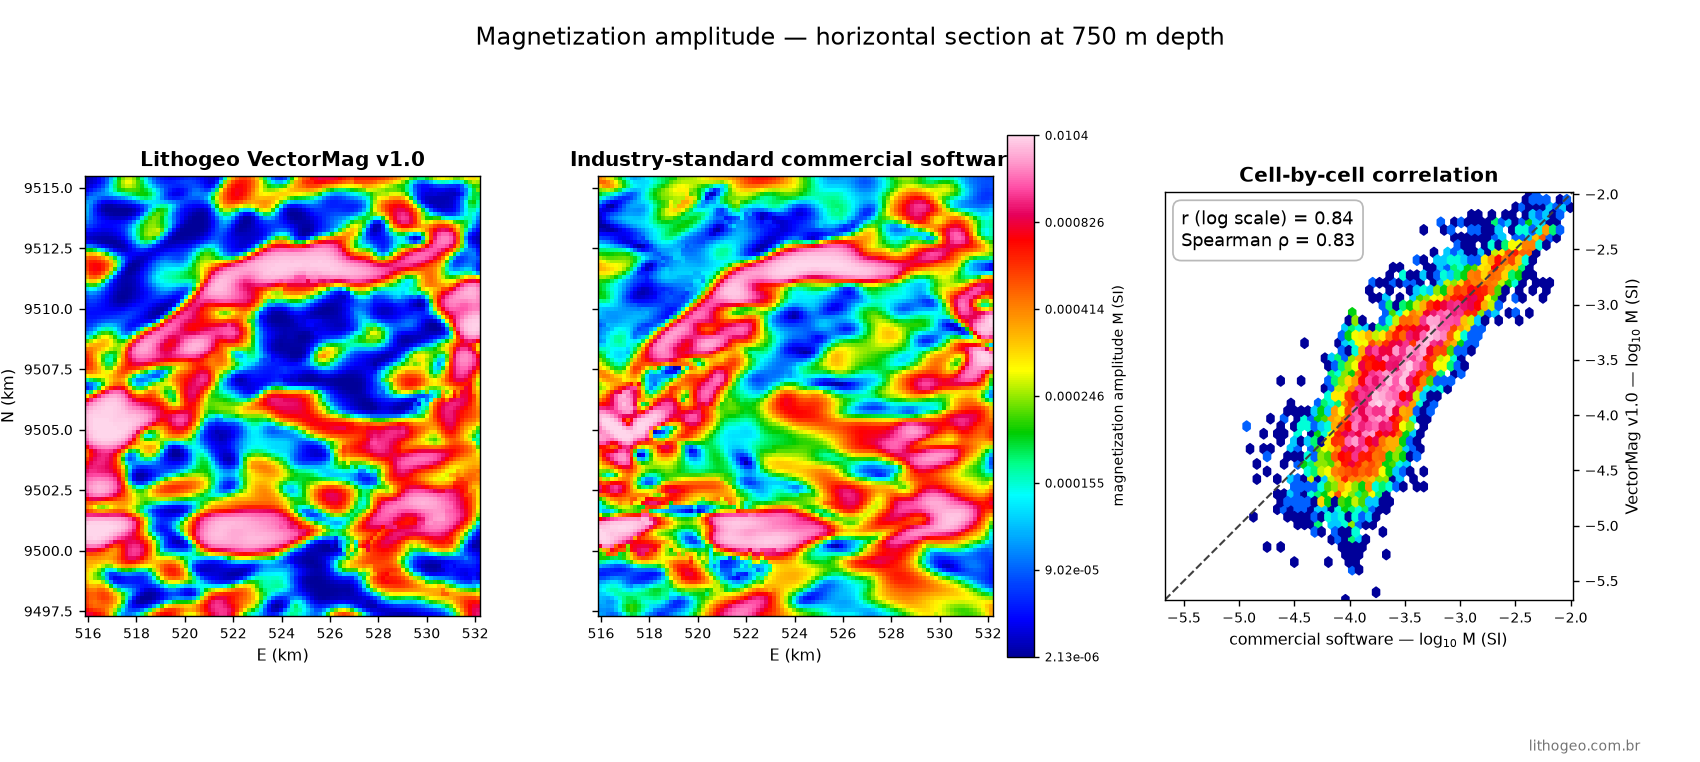
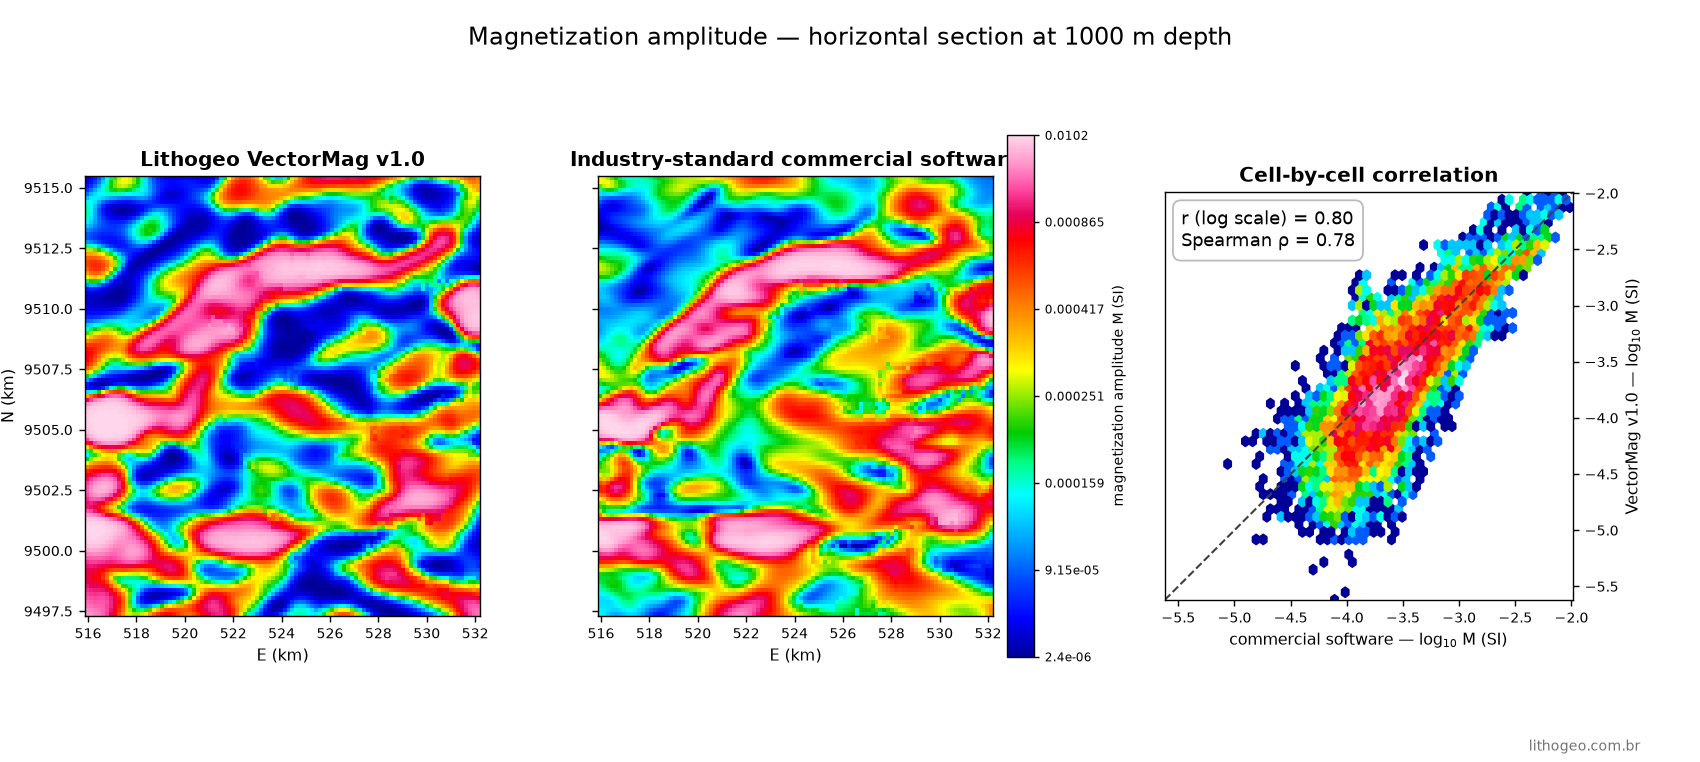
The same bodies, with the same geometry and the same physical scale: the ratio between the two models' median amplitudes stays between 0.9 and 1.1 throughout the column down to ~1,150 m. More slices (50, 150 and 350 m):
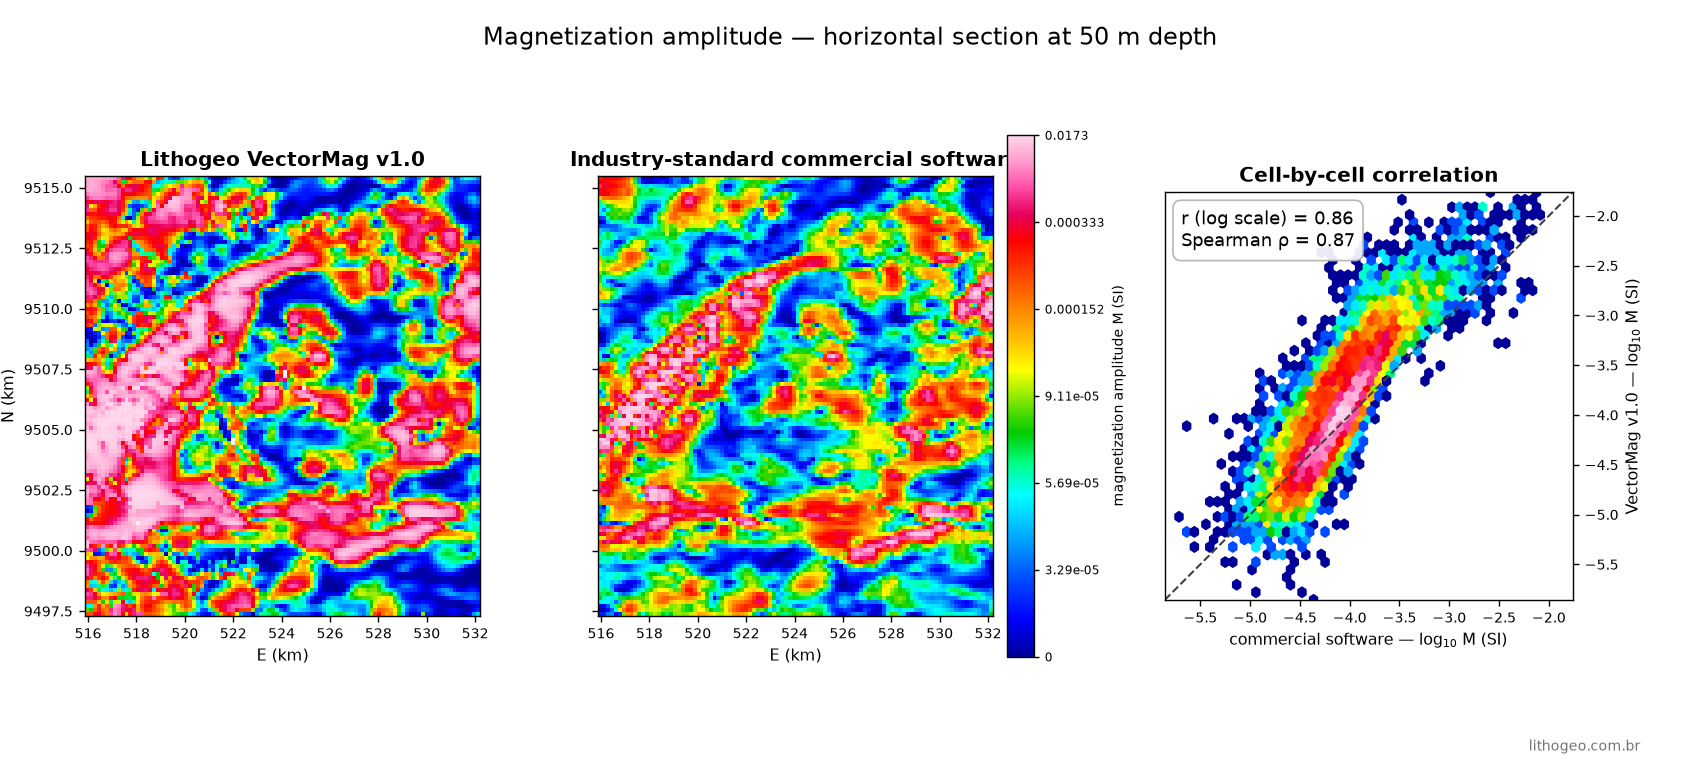
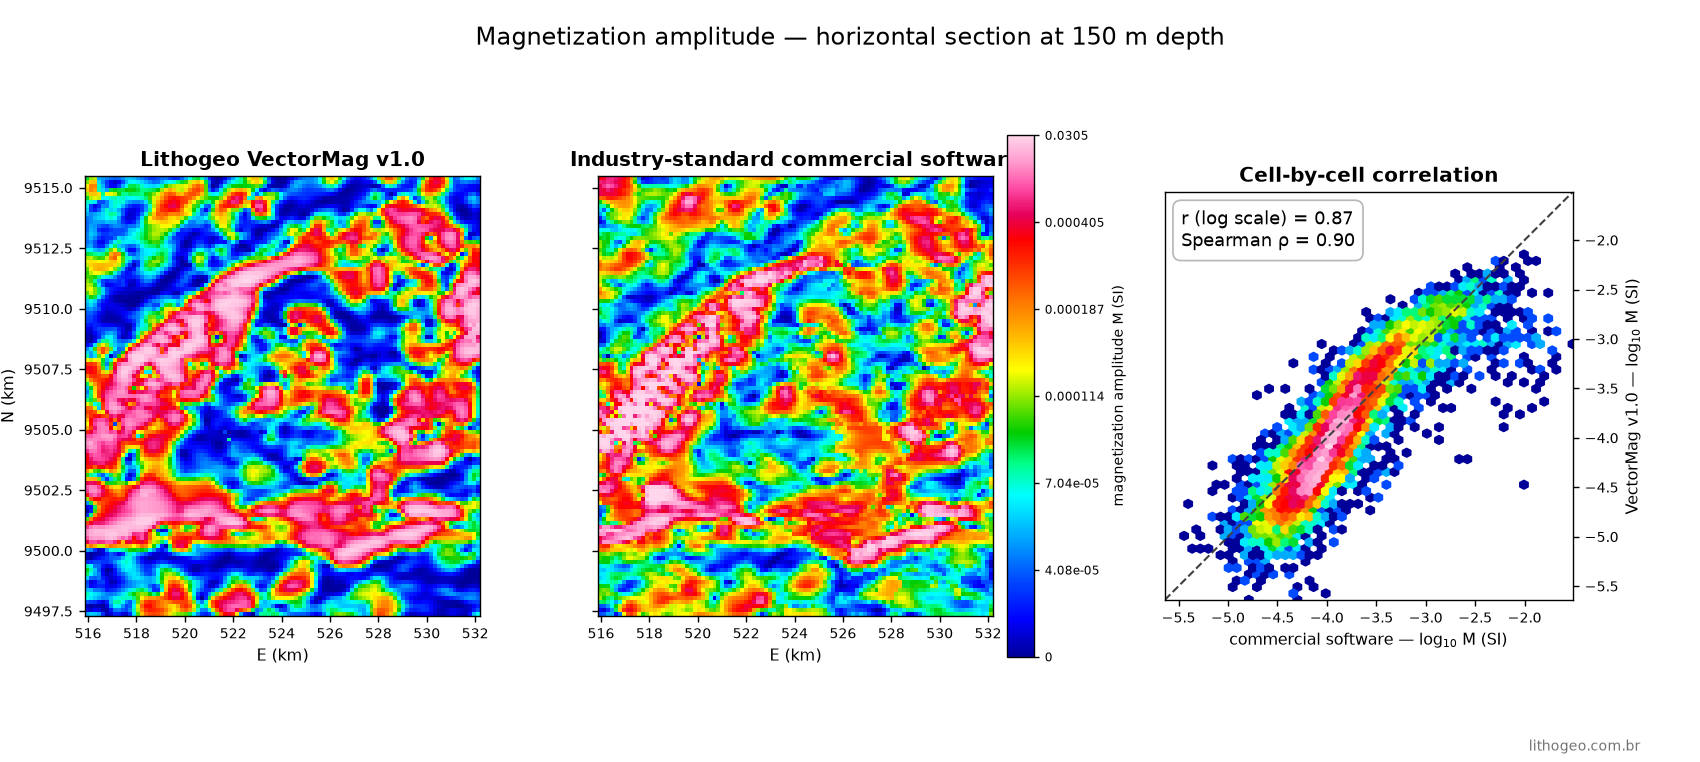
The same targets
High correlation is one thing; pointing at the same places is another. We took each model's most magnetic cells (the top decile, down to 1,000 m) and measured the overlap: 61% of the "hot" cells coincide (Jaccard index 0.61 — chance would give ~5%). In practice: whoever ranks targets with one model or the other is looking at the same bodies.
Transparency: where the models diverge
No inversion sees everything. Below ~2 km, both models are weakly constrained by the data — each resolves that zone with its own mesh and regularization choices, and that is where they diverge most. That is why VectorMag ships the DOI (depth of investigation) with every model: the map of how deep the data actually supports the interpretation. A result is only as good as the honesty about its limits.
What this changes for explorers
The industry-standard commercial software is an excellent tool — and remains the benchmark. The difference is access:
- VectorMag v1.0 runs inside the Lithogeo platform, straight from the browser: no installation, no dedicated license, results in minutes. It is SaaS with accessible pricing: subscribe to a plan or run one-off inversions with credit packages — you pay for what you use, when you need it.
- The traditional path involves an annual subscription, a workstation and cloud processing credits.
And this is the result of v1.0 — the engine's first public release, and it only gets better from here, version by version.
Want to invert your own area? Create your account or explore 3D Magnetic Inversion.